The documentation you are viewing is for Dapr v1.10 which is an older version of Dapr. For up-to-date documentation, see the latest version.
IntelliJ
When developing Dapr applications, you typically use the Dapr CLI to start your ‘Daprized’ service similar to this:
dapr run --app-id nodeapp --app-port 3000 --dapr-http-port 3500 app.js
This uses the default components yaml files (created on dapr init) so that your service can interact with the local Redis container. This is great when you are just getting started but what if you want to attach a debugger to your service and step through the code? This is where you can use the dapr cli without invoking an app.
One approach to attaching the debugger to your service is to first run dapr run -- from the command line and then launch your code and attach the debugger. While this is a perfectly acceptable solution, it does require a few extra steps (like switching between terminal and IDE) and some instruction to developers who might want to clone your repo and hit the “play” button to begin debugging.
This document explains how to use dapr directly from IntelliJ. As a pre-requisite, make sure you have initialized the Dapr’s dev environment via dapr init.
Let’s get started!
Add Dapr as an ‘External Tool’
First, quit IntelliJ before modifying the configurations file directly.
IntelliJ configuration file location
For versions 2020.1 and above the configuration files for tools should be located in:
%USERPROFILE%\AppData\Roaming\JetBrains\IntelliJIdea2020.1\tools\
$HOME/.config/JetBrains/IntelliJIdea2020.1/tools/
~/Library/Application\ Support/JetBrains/IntelliJIdea2020.1/tools/
The configuration file location is different for version 2019.3 or prior. See here for more details.
Change the version of IntelliJ in the path if needed.
Create or edit the file in <CONFIG PATH>/tools/External\ Tools.xml (change IntelliJ version in path if needed). The <CONFIG PATH> is OS dependent as seen above.
Add a new <tool></tool> entry:
<toolSet name="External Tools">
  ...
  <!-- 1. Each tool has its own app-id, so create one per application to be debugged -->
  <tool name="dapr for DemoService in examples" description="Dapr sidecar" showInMainMenu="false" showInEditor="false" showInProject="false" showInSearchPopup="false" disabled="false" useConsole="true" showConsoleOnStdOut="true" showConsoleOnStdErr="true" synchronizeAfterRun="true">
    <exec>
      <!-- 2. For Linux or MacOS use: /usr/local/bin/dapr -->
      <option name="COMMAND" value="C:\dapr\dapr.exe" />
      <!-- 3. Choose app, http and grpc ports that do not conflict with other daprd command entries (placement address should not change). -->
      <option name="PARAMETERS" value="run -app-id demoservice -app-port 3000 -dapr-http-port 3005 -dapr-grpc-port 52000" />
      <!-- 4. Use the folder where the `components` folder is located -->
      <option name="WORKING_DIRECTORY" value="C:/Code/dapr/java-sdk/examples" />
    </exec>
  </tool>
  ...
</toolSet>
Optionally, you may also create a new entry for a sidecar tool that can be reused across many projects:
<toolSet name="External Tools">
  ...
  <!-- 1. Reusable entry for apps with app port. -->
  <tool name="dapr with app-port" description="Dapr sidecar" showInMainMenu="false" showInEditor="false" showInProject="false" showInSearchPopup="false" disabled="false" useConsole="true" showConsoleOnStdOut="true" showConsoleOnStdErr="true" synchronizeAfterRun="true">
    <exec>
      <!-- 2. For Linux or MacOS use: /usr/local/bin/dapr -->
      <option name="COMMAND" value="c:\dapr\dapr.exe" />
      <!-- 3. Prompts user 4 times (in order): app id, app port, Dapr's http port, Dapr's grpc port. -->
      <option name="PARAMETERS" value="run --app-id $Prompt$ --app-port $Prompt$ --dapr-http-port $Prompt$ --dapr-grpc-port $Prompt$" />
      <!-- 4. Use the folder where the `components` folder is located -->
      <option name="WORKING_DIRECTORY" value="$ProjectFileDir$" />
    </exec>
  </tool>
  <!-- 1. Reusable entry for apps without app port. -->
  <tool name="dapr without app-port" description="Dapr sidecar" showInMainMenu="false" showInEditor="false" showInProject="false" showInSearchPopup="false" disabled="false" useConsole="true" showConsoleOnStdOut="true" showConsoleOnStdErr="true" synchronizeAfterRun="true">
    <exec>
      <!-- 2. For Linux or MacOS use: /usr/local/bin/dapr -->
      <option name="COMMAND" value="c:\dapr\dapr.exe" />
      <!-- 3. Prompts user 3 times (in order): app id, Dapr's http port, Dapr's grpc port. -->
      <option name="PARAMETERS" value="run --app-id $Prompt$ --dapr-http-port $Prompt$ --dapr-grpc-port $Prompt$" />
      <!-- 4. Use the folder where the `components` folder is located -->
      <option name="WORKING_DIRECTORY" value="$ProjectFileDir$" />
    </exec>
  </tool>
  ...
</toolSet>
Create or edit run configuration
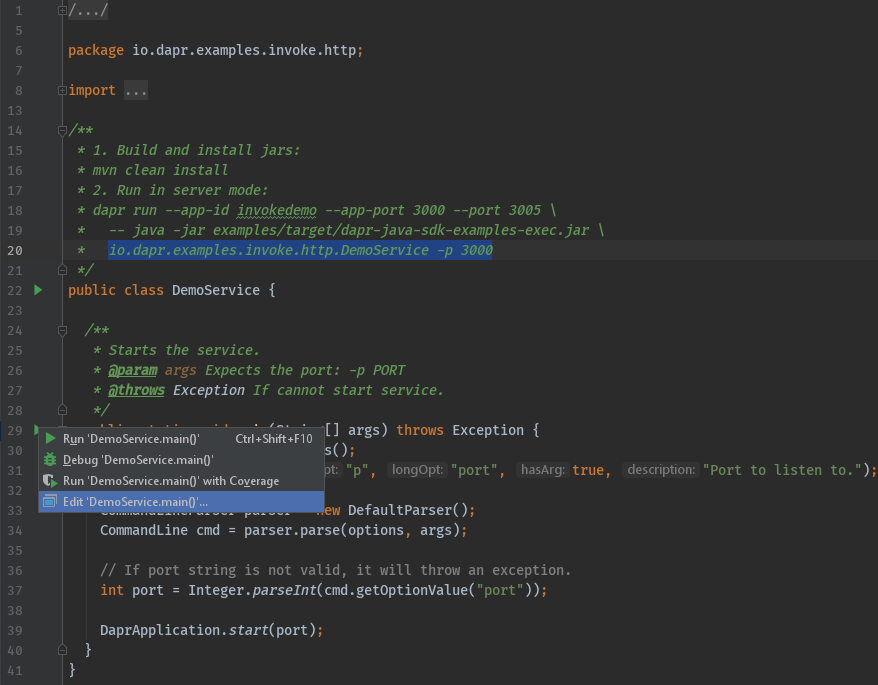
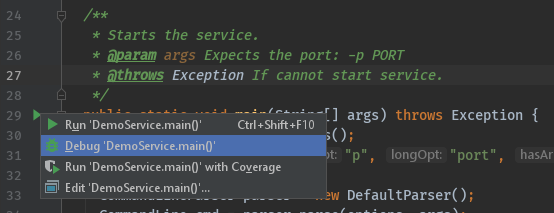
Now, create or edit the run configuration for the application to be debugged. It can be found in the menu next to the main() function.
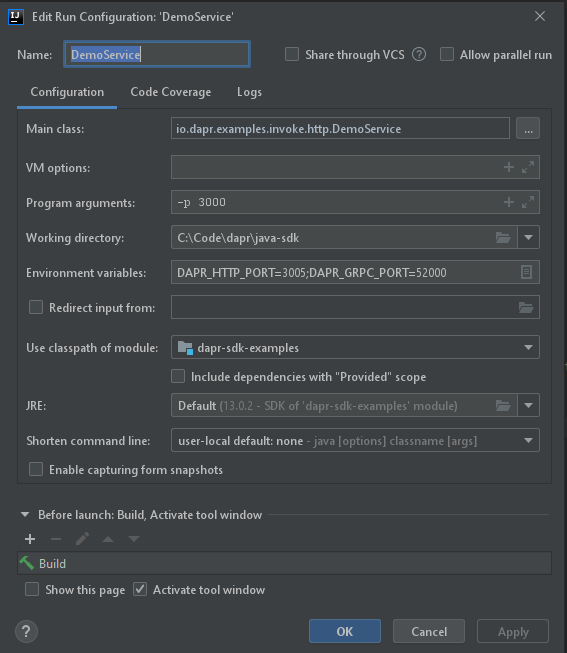
Now, add the program arguments and environment variables. These need to match the ports defined in the entry in ‘External Tool’ above.
- Command line arguments for this example:
-p 3000 - Environment variables for this example:
DAPR_HTTP_PORT=3005;DAPR_GRPC_PORT=52000
Start debugging
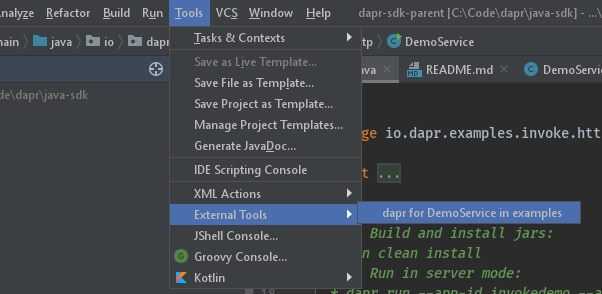
Once the one-time config above is done, there are two steps required to debug a Java application with Dapr in IntelliJ:
- Start
daprviaTools->External Toolin IntelliJ.
- Start your application in debug mode.
Wrapping up
After debugging, make sure you stop both dapr and your app in IntelliJ.
Note: Since you launched the service(s) using the dapr run CLI command, the dapr list command will show runs from IntelliJ in the list of apps that are currently running with Dapr.
Happy debugging!
Related links
- Change in IntelliJ configuration directory location
Feedback
Was this page helpful?
Glad to hear it! Please tell us how we can improve.
Sorry to hear that. Please tell us how we can improve.