The documentation you are viewing is for Dapr v1.10 which is an older version of Dapr. For up-to-date documentation, see the latest version.
How-To: Observe metrics with Grafana
Available dashboards
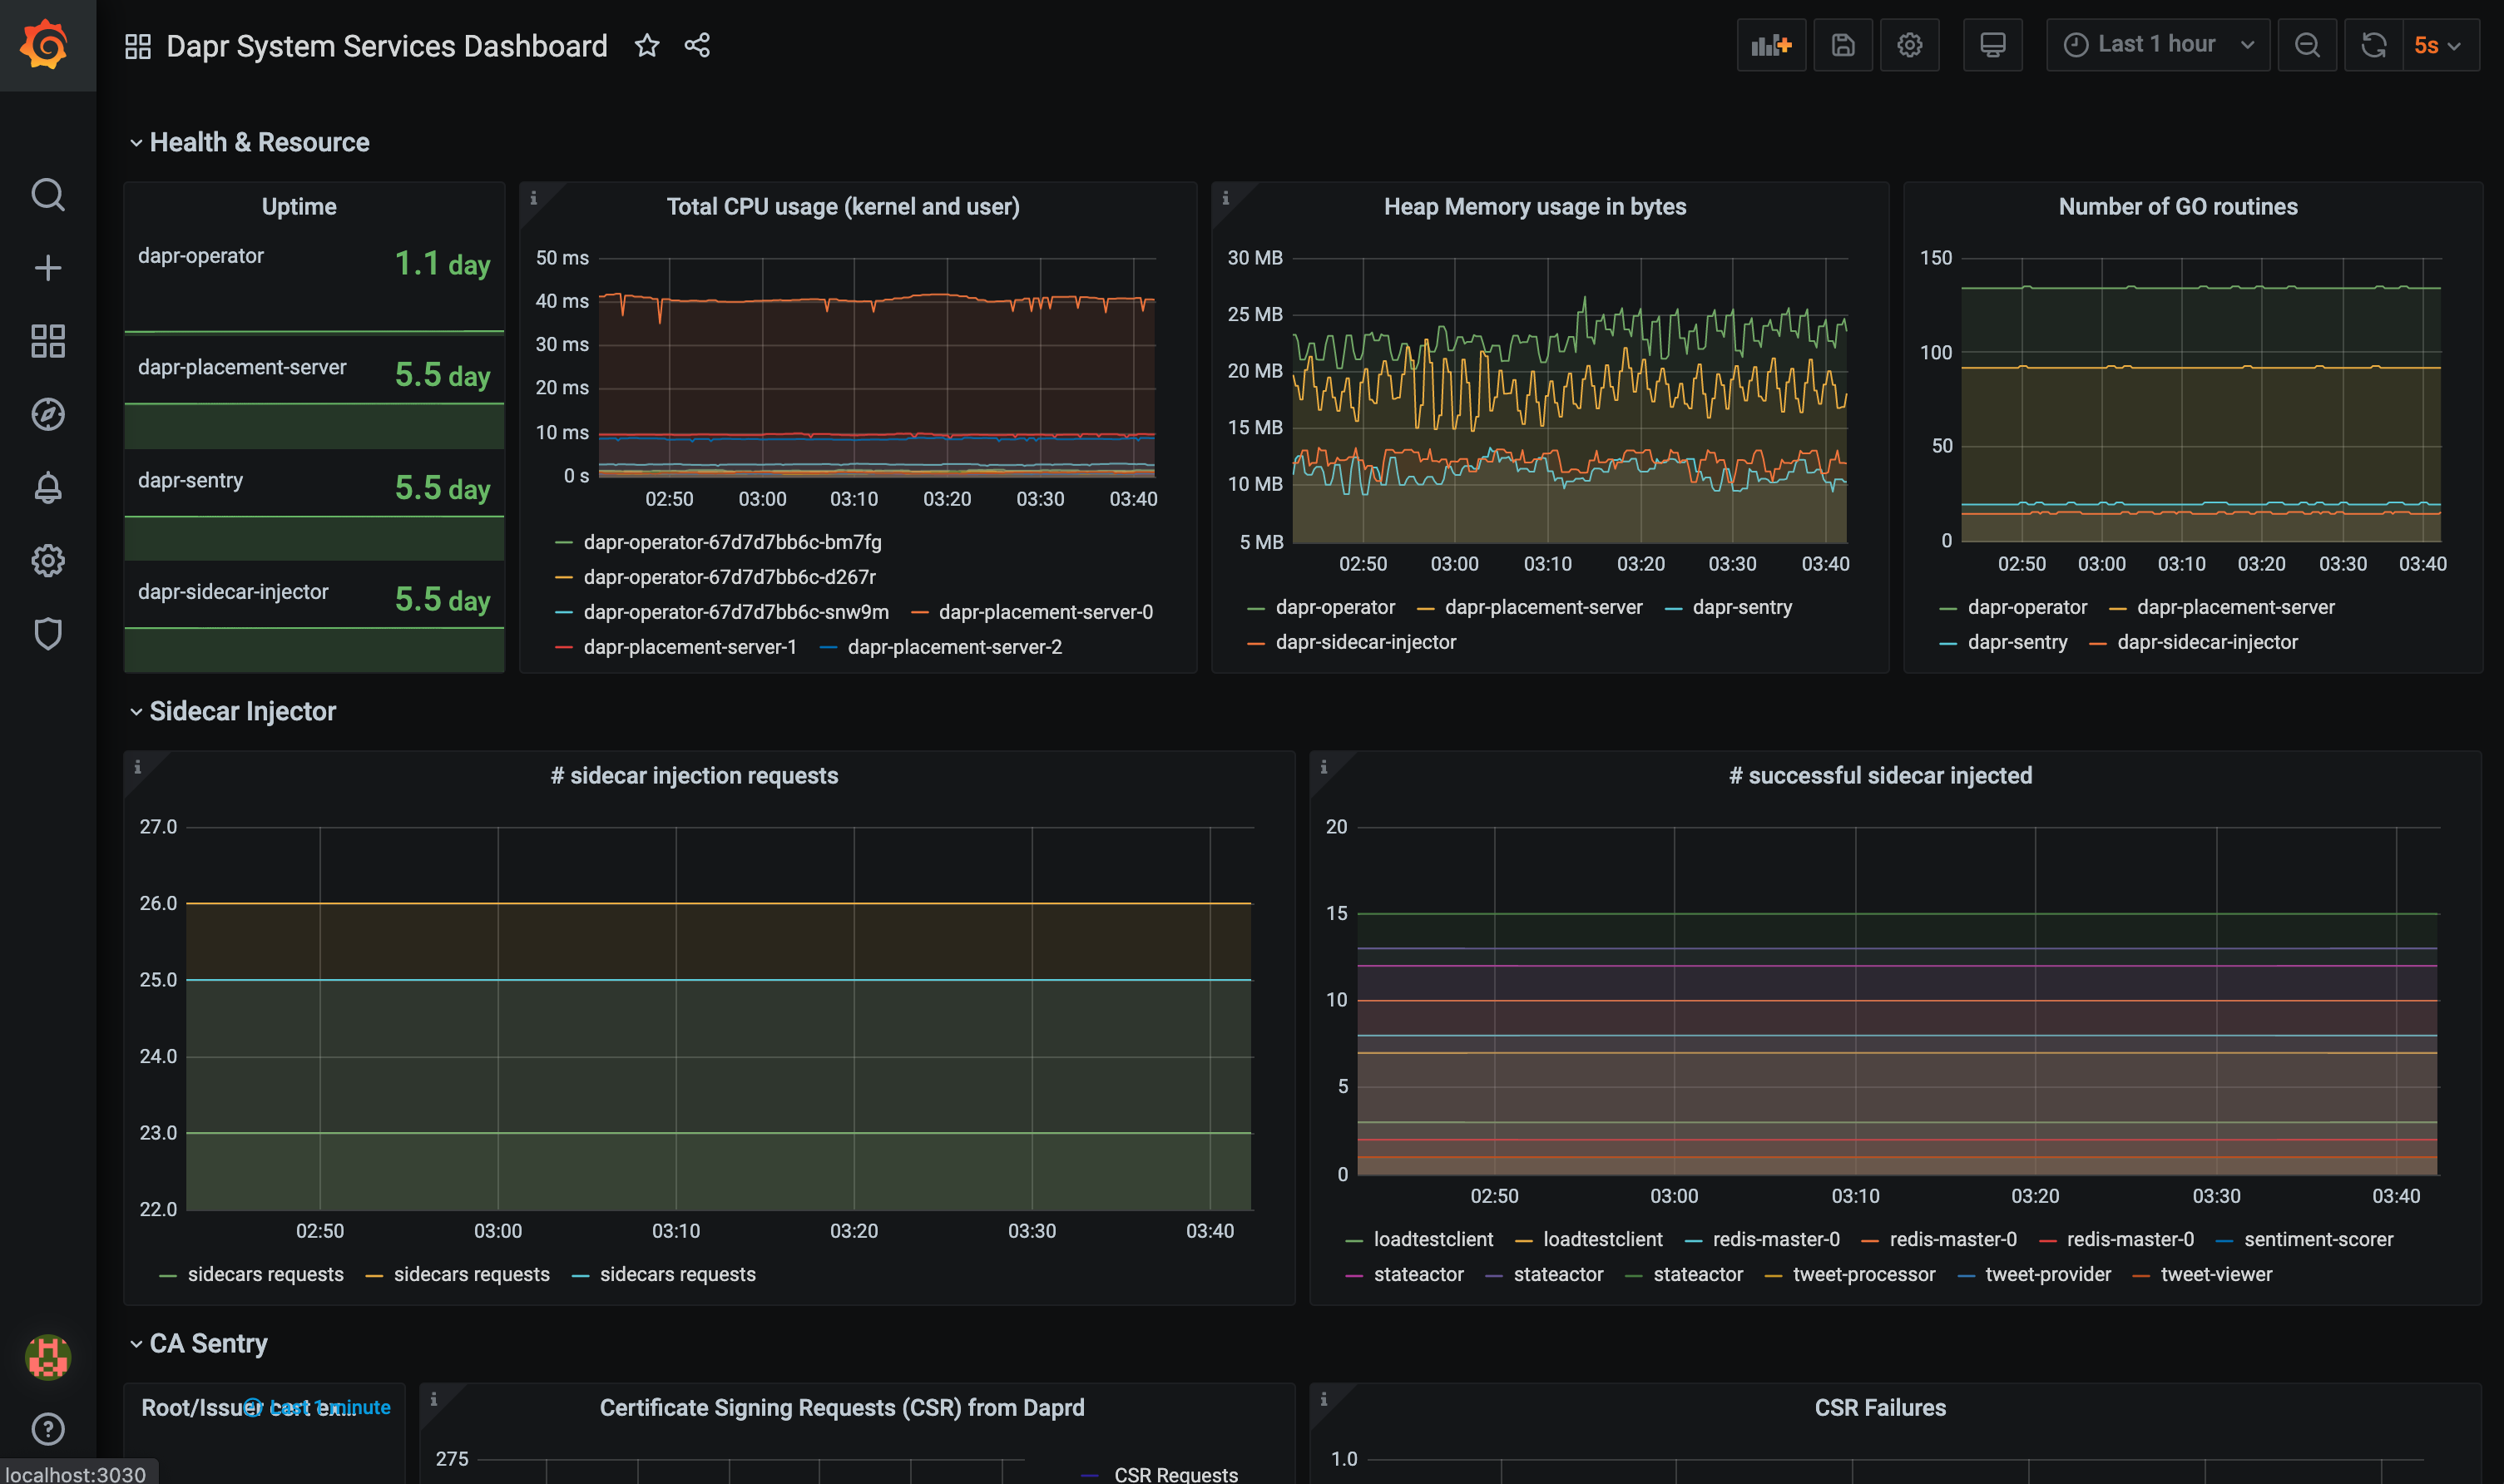
The grafana-system-services-dashboard.json template shows Dapr system component status, dapr-operator, dapr-sidecar-injector, dapr-sentry, and dapr-placement:
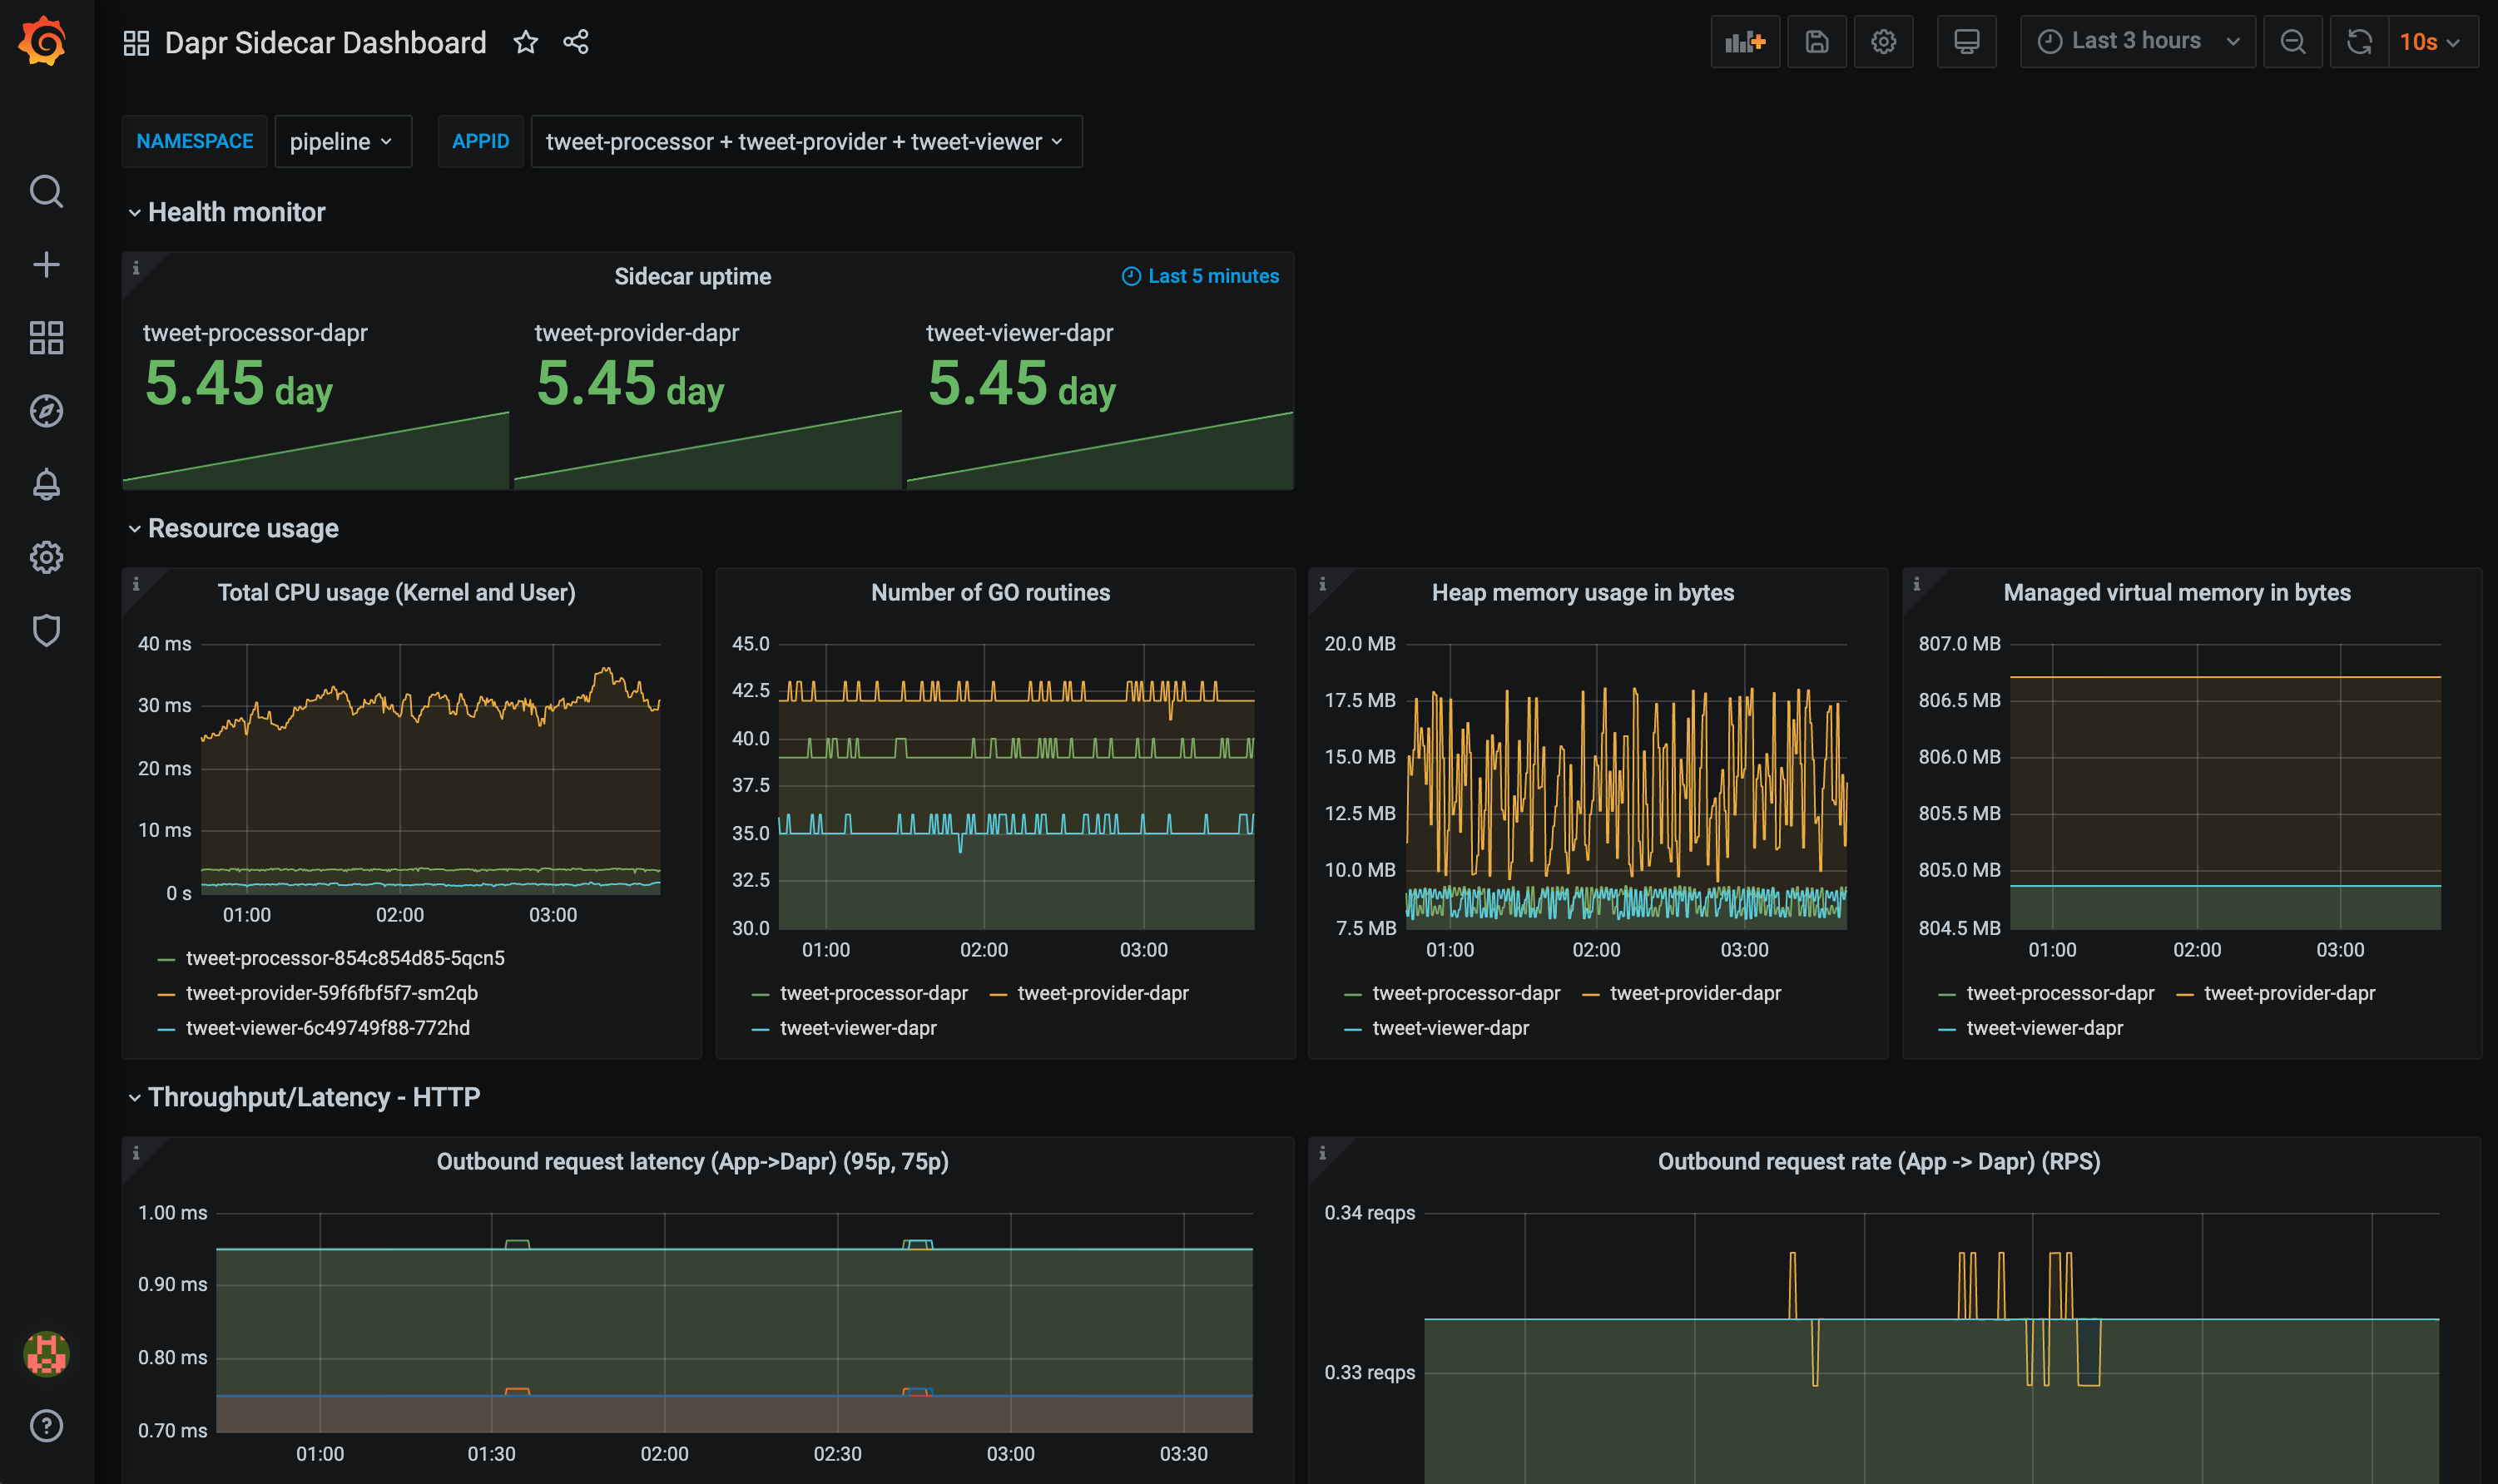
The grafana-sidecar-dashboard.json template shows Dapr sidecar status, including sidecar health/resources, throughput/latency of HTTP and gRPC, Actor, mTLS, etc.:
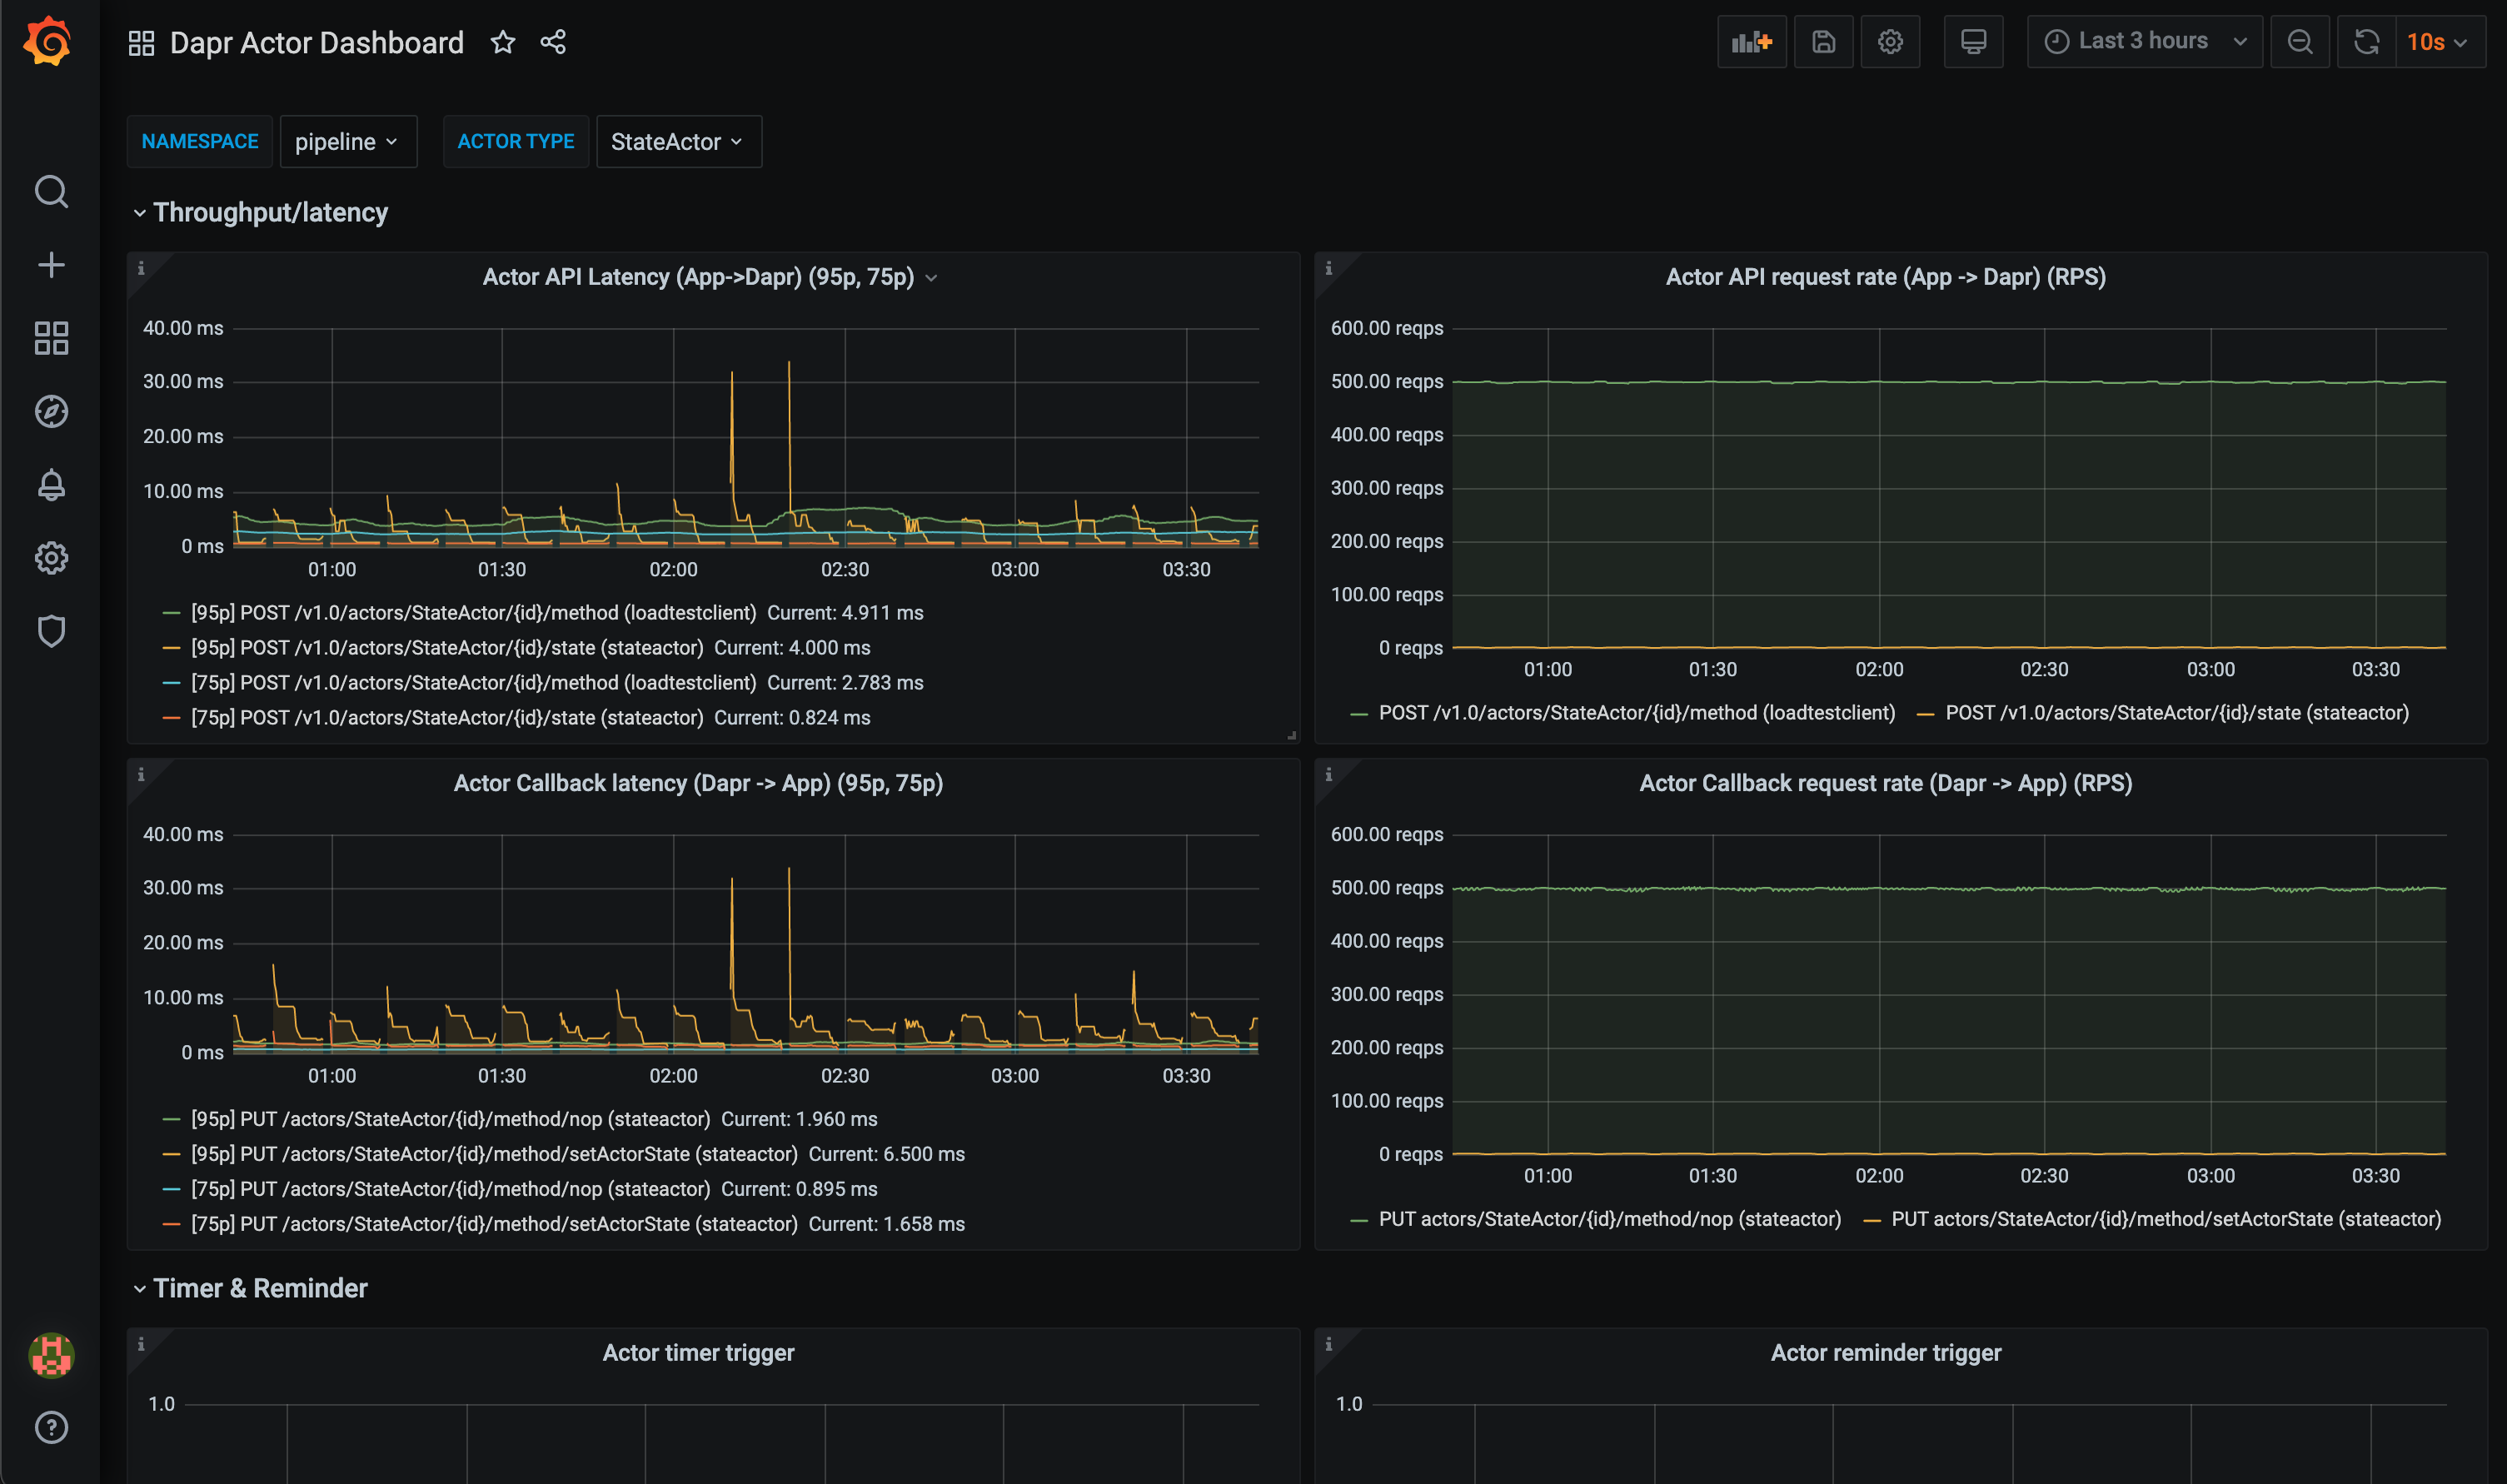
The grafana-actor-dashboard.json template shows Dapr Sidecar status, actor invocation throughput/latency, timer/reminder triggers, and turn-based concurrnecy:
Pre-requisites
Setup on Kubernetes
Install Grafana
-
Add the Grafana Helm repo:
helm repo add grafana https://grafana.github.io/helm-charts helm repo update -
Install the chart:
helm install grafana grafana/grafana -n dapr-monitoringNote
If you are Minikube user or want to disable persistent volume for development purpose, you can disable it by using the following command instead:
helm install grafana grafana/grafana -n dapr-monitoring --set persistence.enabled=false -
Retrieve the admin password for Grafana login:
kubectl get secret --namespace dapr-monitoring grafana -o jsonpath="{.data.admin-password}" | base64 --decode ; echoYou will get a password similar to
cj3m0OfBNx8SLzUlTx91dEECgzRlYJb60D2evof1%. Remove the%character from the password to getcj3m0OfBNx8SLzUlTx91dEECgzRlYJb60D2evof1as the admin password. -
Validation Grafana is running in your cluster:
kubectl get pods -n dapr-monitoring

NAME                                                READY   STATUS       RESTARTS   AGE
dapr-prom-kube-state-metrics-9849d6cc6-t94p8        1/1     Running      0          4m58s
dapr-prom-prometheus-alertmanager-749cc46f6-9b5t8   2/2     Running      0          4m58s
dapr-prom-prometheus-node-exporter-5jh8p            1/1     Running      0          4m58s
dapr-prom-prometheus-node-exporter-88gbg            1/1     Running      0          4m58s
dapr-prom-prometheus-node-exporter-bjp9f            1/1     Running      0          4m58s
dapr-prom-prometheus-pushgateway-688665d597-h4xx2   1/1     Running      0          4m58s
dapr-prom-prometheus-server-694fd8d7c-q5d59         2/2     Running      0          4m58s
grafana-c49889cff-x56vj                             1/1     Running      0          5m10s
Configure Prometheus as data source
First you need to connect Prometheus as a data source to Grafana.
-
Port-forward to svc/grafana:
kubectl port-forward svc/grafana 8080:80 -n dapr-monitoring Forwarding from 127.0.0.1:8080 -> 3000 Forwarding from [::1]:8080 -> 3000 Handling connection for 8080 Handling connection for 8080 -
Open a browser to
http://localhost:8080 -
Login to Grafana
- Username =
admin - Password = Password from above
- Username =
-
Select
ConfigurationandData Sources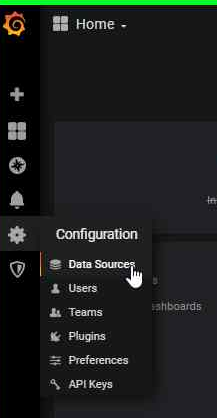
-
Add Prometheus as a data source.
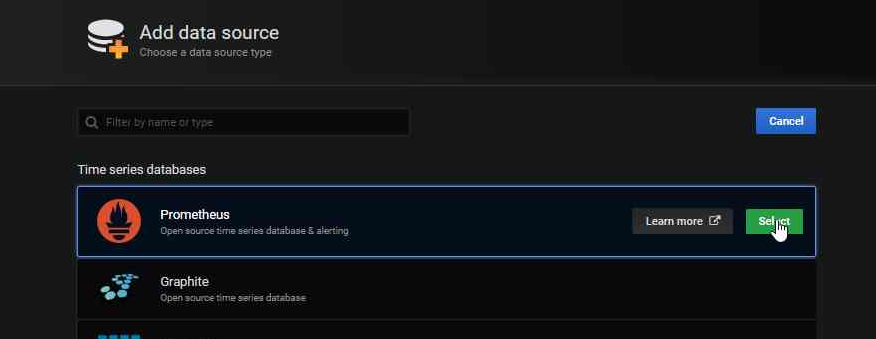
-
Get your Prometheus HTTP URL
The Prometheus HTTP URL follows the format
http://<prometheus service endpoint>.<namespace>Start by getting the Prometheus server endpoint by running the following command:
kubectl get svc -n dapr-monitoring

NAME                                 TYPE        CLUSTER-IP        EXTERNAL-IP   PORT(S)             AGE
dapr-prom-kube-state-metrics         ClusterIP   10.0.174.177      <none>        8080/TCP            7d9h
dapr-prom-prometheus-alertmanager    ClusterIP   10.0.255.199      <none>        80/TCP              7d9h
dapr-prom-prometheus-node-exporter   ClusterIP   None              <none>        9100/TCP            7d9h
dapr-prom-prometheus-pushgateway     ClusterIP   10.0.190.59       <none>        9091/TCP            7d9h
dapr-prom-prometheus-server          ClusterIP   10.0.172.191      <none>        80/TCP              7d9h
elasticsearch-master                 ClusterIP   10.0.36.146       <none>        9200/TCP,9300/TCP   7d10h
elasticsearch-master-headless        ClusterIP   None              <none>        9200/TCP,9300/TCP   7d10h
grafana                              ClusterIP   10.0.15.229       <none>        80/TCP              5d5h
kibana-kibana                        ClusterIP   10.0.188.224      <none>        5601/TCP            7d10h
In this guide the server name is
dapr-prom-prometheus-serverand the namespace isdapr-monitoring, so the HTTP URL will behttp://dapr-prom-prometheus-server.dapr-monitoring. -
Fill in the following settings:
- Name:
Dapr - HTTP URL:
http://dapr-prom-prometheus-server.dapr-monitoring - Default: On
- Skip TLS Verify: On
- Necessary in order to save and test the configuration
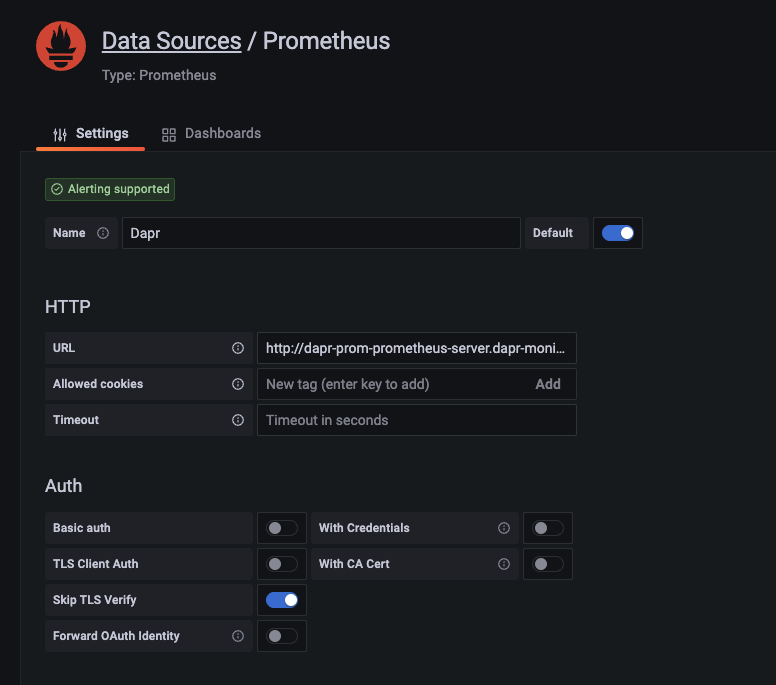
- Name:
-
Click
Save & Testbutton to verify that the connection succeeded.
Import dashboards in Grafana
-
In the upper left corner of the Grafana home screen, click the “+” option, then “Import”.
You can now import Grafana dashboard templates from release assets for your Dapr version:
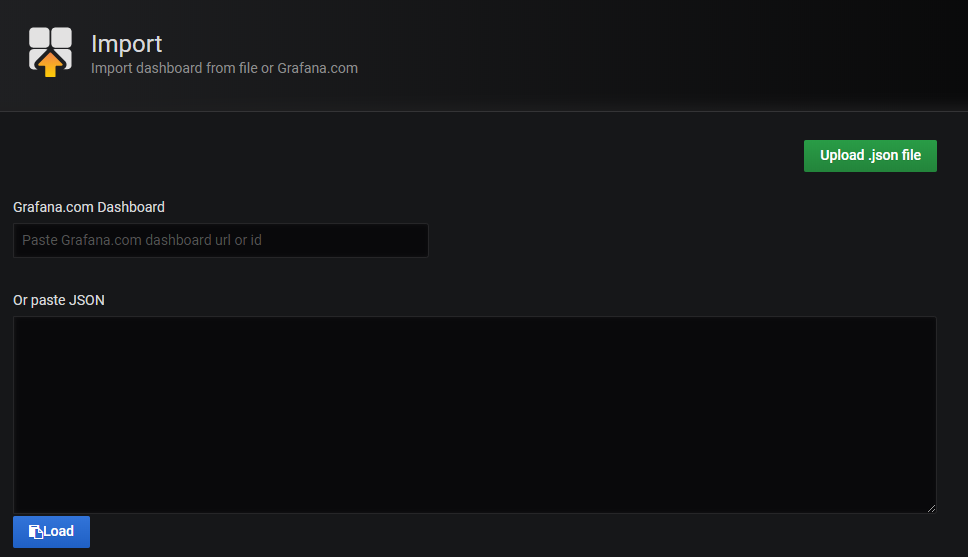
-
Find the dashboard that you imported and enjoy
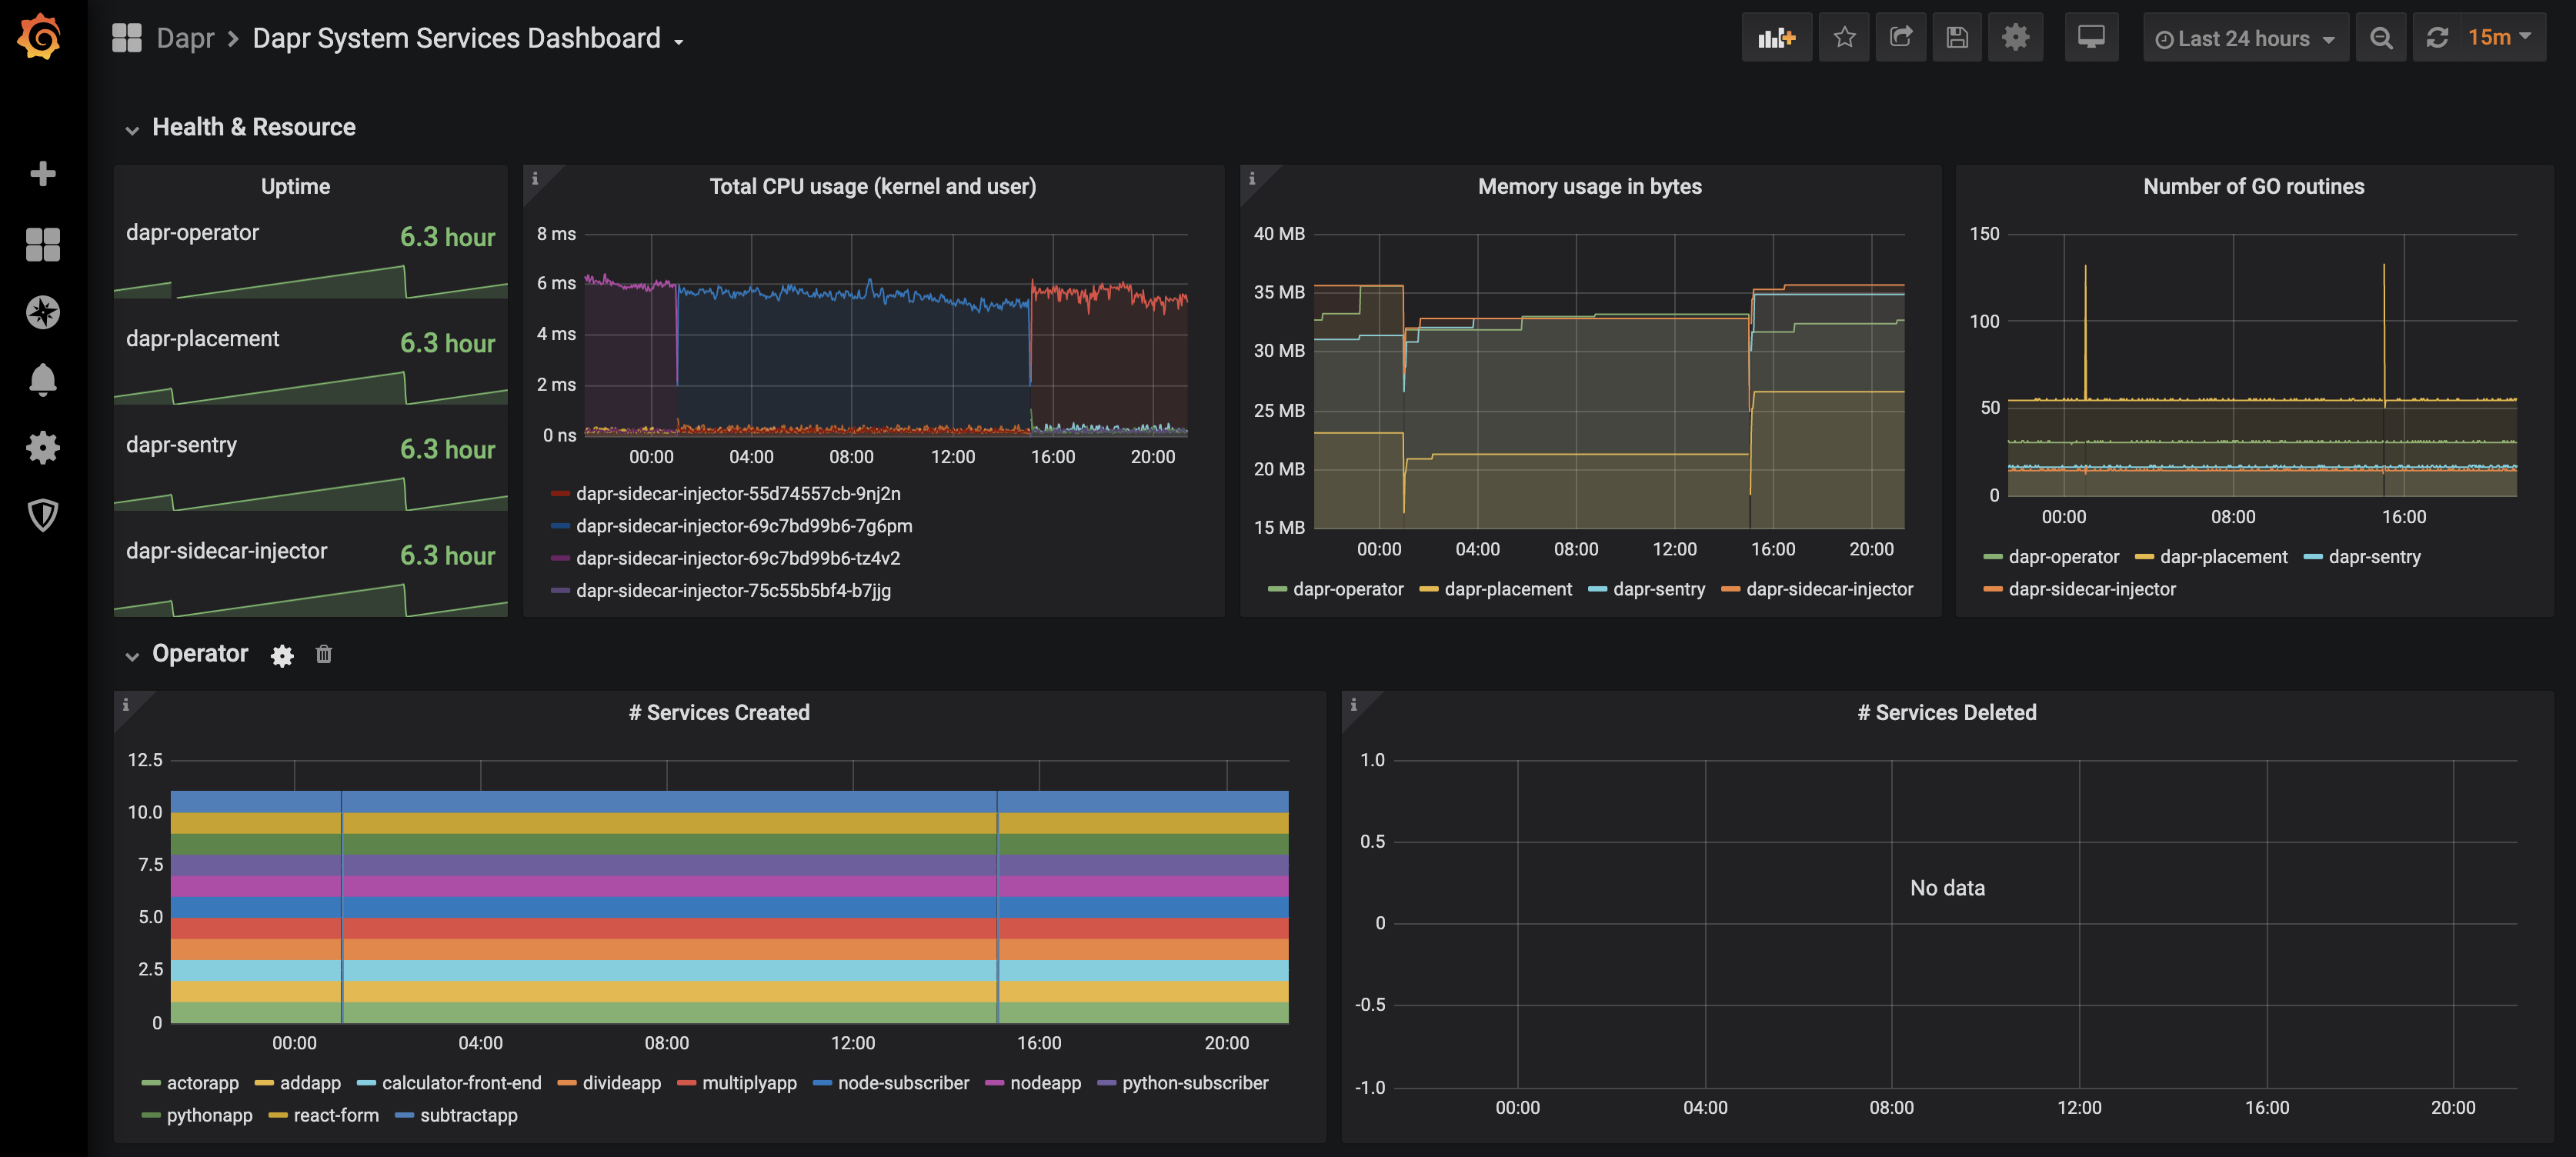
Tip
Hover your mouse over theiin the corner to the description of each chart: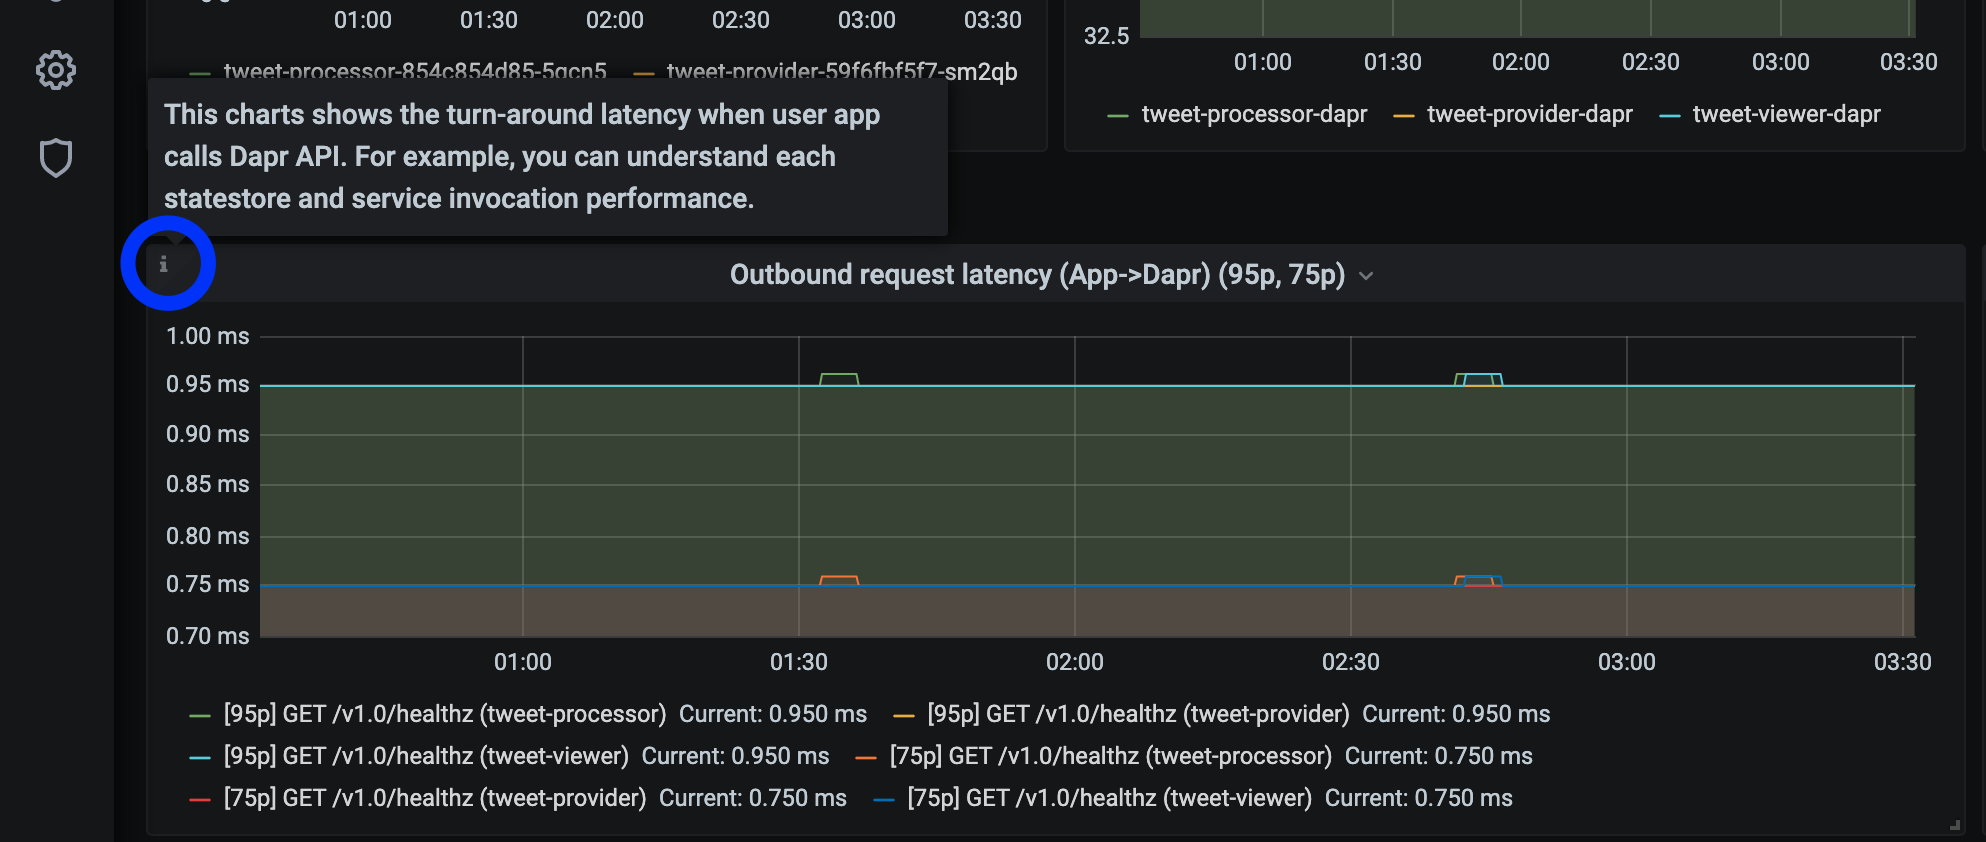
References
- Dapr Observability
- Prometheus Installation
- Prometheus on Kubernetes
- Prometheus Query Language
- Supported Dapr metrics
Example
Feedback
Was this page helpful?
Glad to hear it! Please tell us how we can improve.
Sorry to hear that. Please tell us how we can improve.